![shutterstock_1798585393 [Converted]_edited.jpg](https://static.wixstatic.com/media/d653ed_803506eff6e1490aa097db78cbab815e~mv2.jpg/v1/fill/w_652,h_326,al_c,q_80,usm_0.66_1.00_0.01,enc_avif,quality_auto/d653ed_803506eff6e1490aa097db78cbab815e~mv2.jpg)
BI Solutions
Have a real time pulse on every corner of the organization!
Strategy needs measurement and BI visualizations enable it. By building custom business intelligence visualizations that directly connect with the organizational strategy, root levers and operational processes, our clients have been able to measure, adjust and realize the outcomes they targeted.
Using our bI solutions, large pharmaceutical distributors have been able to increase their market penetration by 12% YoY while decreasing system level inventory by 17% in the first year itself. Our NHS trust clientele in the United kingdom have been able to decrease turnaround times in service by 26% while increasing patient utilization by 15%.
Our BI service solutions support your strategy by integrating right analytics for every level of the organization while delivering it through easy to understand, custom-made visualizations so you can manage effortlessly.

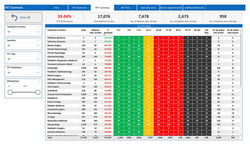
We create bespoke BI visualisations for ED, inpatient flow and bed management, readmission, theatre utilisation, RTT monitoring, and many more and below are some of our key BI visualizations (dashboards) which can be curated, developed based on our client requirements.


Inpatient specific BI visualizations
 |  |  |  |
|---|---|---|---|
 |  |
RTT specific BI visualizations
 |  |  |  |
|---|---|---|---|
 |  |
Readmission specific BI visualizations
 |  |
|---|